
Skip Nav Destination
Close Modal
Search Results for
aluminum alloy 7075
Update search
Filter
- Title
- Authors
- Author Affiliations
- Full Text
- Abstract
- Keywords
- DOI
- ISBN
- EISBN
- Issue
- ISSN
- EISSN
- Volume
- References
Filter
- Title
- Authors
- Author Affiliations
- Full Text
- Abstract
- Keywords
- DOI
- ISBN
- EISBN
- Issue
- ISSN
- EISSN
- Volume
- References
Filter
- Title
- Authors
- Author Affiliations
- Full Text
- Abstract
- Keywords
- DOI
- ISBN
- EISBN
- Issue
- ISSN
- EISSN
- Volume
- References
Filter
- Title
- Authors
- Author Affiliations
- Full Text
- Abstract
- Keywords
- DOI
- ISBN
- EISBN
- Issue
- ISSN
- EISSN
- Volume
- References
Filter
- Title
- Authors
- Author Affiliations
- Full Text
- Abstract
- Keywords
- DOI
- ISBN
- EISBN
- Issue
- ISSN
- EISSN
- Volume
- References
Filter
- Title
- Authors
- Author Affiliations
- Full Text
- Abstract
- Keywords
- DOI
- ISBN
- EISBN
- Issue
- ISSN
- EISSN
- Volume
- References
NARROW
Format
Topics
Book Series
Date
Availability
1-20 of 437 Search Results for
aluminum alloy 7075
Follow your search
Access your saved searches in your account
Would you like to receive an alert when new items match your search?
1
Sort by
Image
Published: 01 January 2000
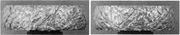
Fig. 15 Two views of a 72% compressed specimen of aluminum alloy 7075-T6 displaying orange peel effect. The loading axis is vertical. Extensive macrocracking is evident in the severely wrinkled surface. Microscopic examination of the surface revealed extensive microcracking in the valleys
More
Image

Published: 01 January 1996
Image

Published: 31 December 2017
Fig. 15 Mass loss curves for three different metallic alloys: aluminum alloy 7075, nickel-aluminum-bronze alloy C95400, and duplex stainless steel A2205. Mass loss tests were conducted in the LEGI cavitation erosion tunnel (see Fig. 9 ). Upstream pressure 40 bar, cavitation number 0.9
More
Image

Published: 01 January 1987
Fig. 1004 An aluminum alloy 7075-T736 aircraft main landing gear forging, similar to that described in Fig. 1002 and 1003 , which was shot peened on its inner-diameter surface to enhance fatigue resistance. The shot-peened part withstood cycles far beyond the number required for acceptance
More
Image

Published: 01 January 1987
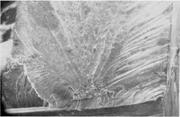
Fig. 1009 Specimen of aluminum alloy 7075-T6 broken in a slow-bend fracture-toughness test in air. Dark area, at left, is the fatigue-precrack surface, which shows no fatigue striae. At right is the tension-overload fracture surface; here, the surface appears dimpled, although
More
Image

Published: 01 January 1987
Fig. 1012 Fracture surface of an aluminum alloy 7075-T6 specimen broken in a slow-bend fracture-toughness test in mercury vapor. Obviously, this is completely brittle fracture. Many facets show faint characteristics of quasi-cleavage. Note the large number of secondary cracks, possibly
More
Image

Published: 01 January 1987
Fig. 1018 Tension-overload fracture in notched specimen of aluminum alloy 7075-T6. Notched tensile strength, 750 MPa (109 ksi); unnotched tensile strength, same as in Fig. 1015 . Surface is flat and coarsely fibrous. Considerable secondary cracking is evident, even at this low magnification
More
Image

Published: 01 January 1987
Fig. 1024 High-cycle fatigue fracture in aluminum alloy 7075-T6 (same mechanical properties as in Fig. 1015 ) loaded in tension-tension with R = 0.1 and a maximum loading of about 159 MPa (23 ksi). Fracture was at 548,000× cycles. Gouge near center is post-test mechanical damage. See also
More
Image
Published: 01 January 1987
Fig. 1042 Fatigue fracture in a notched plate specimen of aluminum alloy 7075-T6 subjected to cyclic stresses in air. (Notch is at bottom; sides of plate, at far left and right). It is apparent that the fracture consists of at least three cracks that formed on various planes and temporarily
More
Image

Published: 01 January 1987
Fig. 1043 Fatigue fracture in a specimen of aluminum alloy 7075-T6 tested in air. The surface exhibits a pattern of brittle, widely spaced striations (at arrows) that are nearly parallel to a grain boundary (A-A). The tensile component (wide, flat region) of each striation was formed
More
Image

Published: 01 January 1987
Fig. 1044 Corrosion-fatigue fracture in a specimen of aluminum alloy 7075-T6 tested in distilled water. Surface exhibits fatigue striations. The unusual sharp angle in the striations defines the location of a nearly vertical grain boundary in the central grain. Area in rectangle is shown
More
Image
Published: 01 January 1987
Fig. 1046 Corrosion-fatigue fracture in a specimen of aluminum alloy 7075-T6 that was tested in a 3.5% NaCl solution. Surface shows two types of striations: at left and at lower right are grains with ductile striations, and between them lies a grain with pronounced brittle striations. See also
More
Image
Published: 01 January 1987
Fig. 1048 Corrosion-fatigue fracture in aluminum alloy 7075-T6 tested in a 3.5% NaCl solution. During testing, specimen was subjected to an applied electrical potential of −0.700 mV as measured against a standard calomel electrode. A mixture of ductile striations (at A) and brittle striations
More
Image

Published: 01 January 1987
Fig. 1049 Corrosion-fatigue fracture in a specimen of aluminum alloy 7075-T6 tested in a 3.5% NaCl solution and, during testing, subjected to an applied electrical potential of −1.200 mV (versus −0.700 mV for the specimen in Fig. 1048 ). Surface shows brittle striations with typical
More
Image

Published: 01 January 1987
Fig. 1050 Corrosion-fatigue fracture in a specimen of aluminum alloy 7075-T6 that, like the specimen in Fig. 1049 , was tested in a 3.5% NaCl solution while subjected to an applied electrical potential of −1.200 mV. Note the extremely large striation spacing; only two readily apparent
More
Image
Published: 01 January 1987
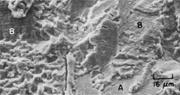
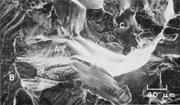
Fig. 1052 Fatigue-fracture surface of a test bar cast from aluminum alloy 7075, aged to the T6 temper and then tested in a 3.5% NaCl solution. A diagonal region of fatigue striations is visible at A; this region abuts areas of intergranular fracture (at B) and interdendritic porosity (at C
More
Image
Published: 01 January 1987
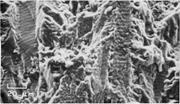
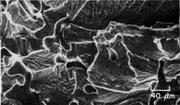
Fig. 1053 Fatigue-fracture in a cast single-crystal specimen of aluminum alloy 7075 that was aged to the T6 temper and then tested in a 3.5% NaCl solution. Most of the view is filled with an interdendritic network of solidification porosity, which did not halt or blunt the fatigue crack. SEM
More
Image

Published: 01 January 1987
Fig. 1055 An area of the corrosion-fatigue fracture surface of an aluminum alloy 7075-T651 that was tested in a 3.5% NaCl solution under a cyclic stress-intensity range (Δ K ) of 6.6 MPa m (6 ksi in. ) at 10 cps. Ductile and brittle striations would be expected
More
Image

Published: 01 January 1987
Fig. 1065 Polished and etched section through the fractured aluminum alloy 7075-T6 bulkhead cap in Fig. 1060 , showing the fracture surface in profile at left. Note change in grain flow produced during extrusion, from a longitudinal orientation at right to transverse at left; transverse
More
Image

Published: 01 December 1998
1